

Many articles, presentations, and how-to guides have heralded the end of Universal Analytics (UA) for months. You may already have some GA4 properties set up, or you have plans to transition soon.
We're now entering a new phase in the migration from UA to GA4: the initial shock and frustration of the migration have likely dissipated and, in many cases, replaced by the constant annoyance of facing a platform that can't do quite what you need it to. In the coming months, SimpsonScarborough will provide articles and resources highlighting challenges you'll likely encounter as your analytics property matures and ways to take your GA4 skills to the next level. For more downloadable resources, visit our GA4 Resources Page.
GA4 has introduced a suite of new, tweaked, and changed metrics that fundamentally alter how we measure website analytics. As the prospective student journey continues to expand beyond the traditional .edu, higher ed marketers will need to sharpen data-driven insights to better understand how users are actually behaving across platforms and channels. For example, if a prospective student lands on an article like “What can I do with a chemistry degree?” and spends some time (more than 10 seconds) reading it, but doesn’t click anything else, we’ll be able to measure the engagement — the part where a user actually reads content— in GA4.
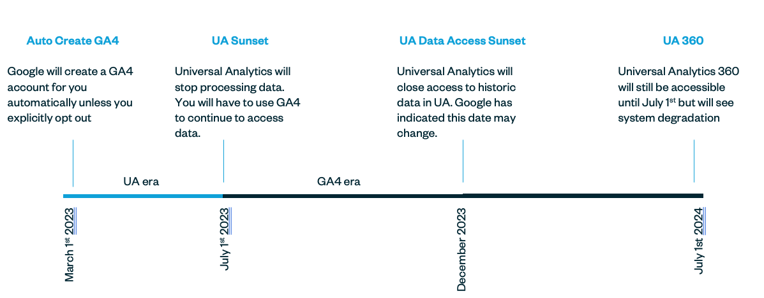
Our Analytics team compiled a list of changes coming to metrics that will help you anticipate and proactively plan for the impacts to your data's integrity. All teams reliant on GA4 for reporting should review this list and determine how these key changes impact measurements. In some cases, metrics in both GA4 and UA have similar names (sessions, time-on-page, etc.) but differ across the two platforms. In other cases, common measurement techniques (like goals) have been totally replaced. Adjusting measurement plans and stakeholder expectations will help to mitigate confusion when the transition becomes permanent in July.
GA4 and UA Have Big Differences Under the Hood
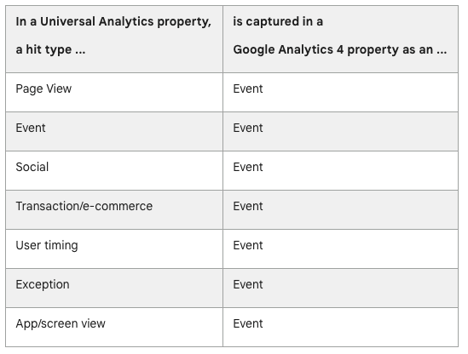
One of the most notable differences between UA and GA4 is architecture: GA4 relies on an event-based model, and how Google counts user actions has changed. While UA had different actions a user could take, GA4 now classifies those actions as events. What does this mean?
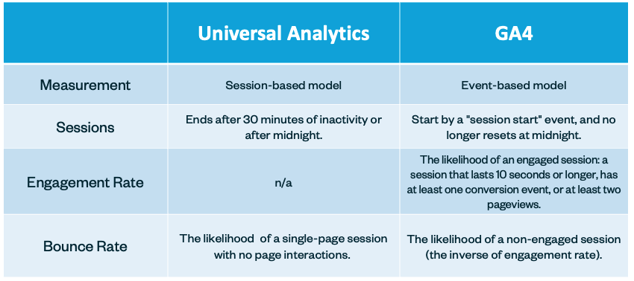
Sessions are now event-based (started by a "session start" event) and no longer reset at midnight; Google defines a session's duration as "the time span between the first and last event in the session."
Bounce rate has also undergone significant changes. In UA, bounce rate was the likelihood of a single-page session with no page interactions. GA4 redefines bounce rate as the likelihood of a non-engaged session—the inverse of a new metric, engagement rate. Initially, Google stated that bounce rate would sunset with UA in favor of engagement rate (defined as the likelihood of an engaged session: a session that lasts 10 seconds or longer, has at least one conversion event, or at least two pageviews) but reversed their decision after user pushback.
We recommend replacing bounce rate with engagement rate in your reporting. Engagement rate is more intuitive as it reports how engaged users are rather than how unengaged they are. It makes more sense to aim to increase engagement rather than decrease disengagement. The changes to bounce rate make comparing GA4's bounce rate to UA's bounce rate misleading. Replacing bounce rate with engagement rate in your reporting will allow for a straightforward transition and help stakeholders understand the difference between these metrics.
In GA4, it's All About Engagement
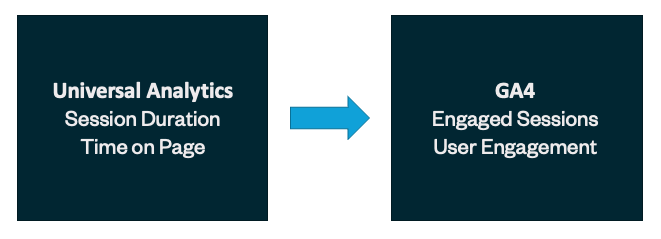
With GA4 comes a suite of new metrics centered around engagement. GA4 replaces average session duration and time on a page with engaged sessions and user engagement.
In UA, average session duration could be misleading — it would continue to count a user's session duration if, for instance, the user had the window open but was not currently viewing it. The new average engagement time metric helps eliminate this by only tracking the time that users are engaged on your site. Similarly, the new active user metric consists of unique new users and users with engaged sessions.
Your Custom Tracking is Changing, Too
GA4 also brings changes to custom events and conversion tracking.
In UA, goals (conversions) measured the most important user actions. Custom goals had a category (button, form, etc.), action (click, submission, etc.), label, and value. Each user could only generate one conversion per session per goal type.
GA4 allows users to generate more than one conversion per session per conversion type. Conversions in GA4 are formatted the same as custom events, and the new event-based model also provides you and your team with more customization via custom event parameters.
In addition, custom event tags built in GTM for UA do not work with GA4. You must transition UA tags to the new GA4 event tag in GTM.
Changes to Your Data Privacy
Data thresholds and sampling are two other significant changes to be aware of that increase privacy.
With the new focus on user privacy, GA4 applies data thresholds that withhold some data from your report to prevent the identity of specific users from being inferred by applying filters and segments to the data.
Another way GA4 provides greater data privacy is with data sampling. Occasionally, you may notice data missing from your reports along with a yellow warning symbol. This symbol indicates that Google Analytics used machine learning to apply data sampling. There are many reasons why sampling is applied to your reports. Usually, sampling is applied if you create a query that analyzes a large amount of data (500K+) or old data (14+ months).
Embrace the Change
GA4 redefines how we approach website analytics and is an excellent opportunity for higher ed marketing teams to familiarize themselves with a new framework. By examining the core differences between GA4 and UA, prioritizing engagement, updating custom tracking strategies, and addressing data privacy concerns, your institution will be well-equipped to thrive in this exciting new era of digital analytics.
Adam Mothersbaugh is a Junior Analyst at SimpsonScarborough, and works to uncover insights that drive big ideas and measure success for clients, and is no stranger to the impact of higher education.
As the Associate Director of Data Products, Alex Ahlstrom leads data systems, data integrations, and digital analytics. He believes that better data provides better and more equitable outcomes.
Learn more about Adam and Alex, and the rest of team here.